I’m going to start posting future posts over here at https://qualitypolicing.com/. (No point in keeping two blogs sites, especially when the posts are infrequent.)
Copinthehood.com has moved to qualitypolicing.com
-
Fewer people shot and killed by police
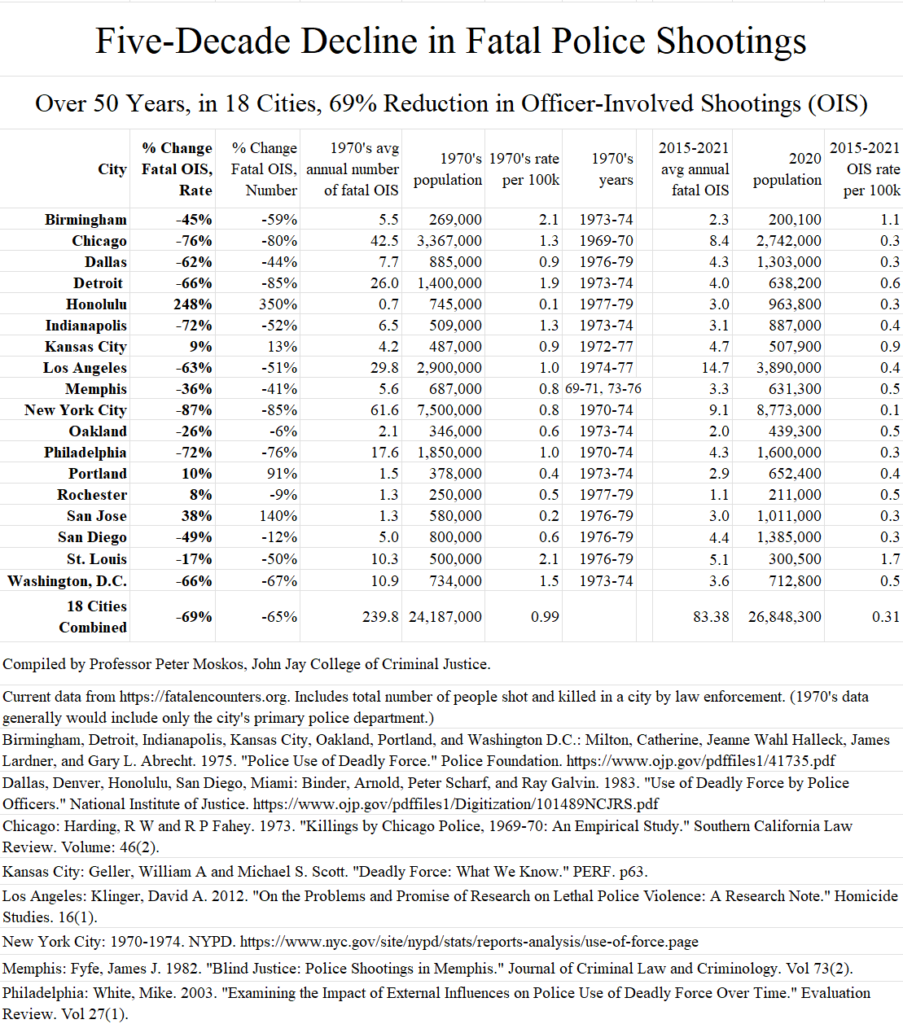
I think this is the first time anybody has been able to compare police use-of-lethal force, apples-to-apples, over 50 years, with honest, reliable, and accurate data! It would be better to have total number of people shot by cops, simply to have a larger n (a bigger sample, for statistical reasons), but the problem is those numbers don’t reliably exist for cities today. On that, see Nix’s article. Because of that, I wouldn’t read too much into the increases above (except Honolulu, which is an interesting outlier) in Portland and San Jose. But I don’t know, that’s the problem with a small sample size of rare events.
This isn’t big news if this is your field. But there was a recent Guardian headline that got my goat:
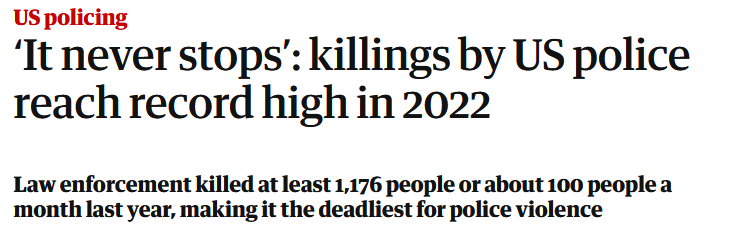
This bothered a lot of people, me included, because it’s — I don’t know how else to put this — a lie.
I mean you can think it’s true and be honestly mistaken. You’re wrong, but you can learn. I’ve got no issue with that. I’m an “educator,” as they say (personally I like “teacher” or “professor”). But the people at the “Mapping Police Violence” project? They’re not stupid. They must know. Right? They fed the story to The Guardian (more than willing to lap it up). And now people can cite The Guardian as gospel, and the circle is complete!
Here’s the thing. It’s just not true. It’s like not even close to true. Not unless “ever” only goes back to 2015. The first year of decent national data (the best source was, Fatal Encounters, which unfortunately retired after 2021), the US population has gone up 4%. Murders are up 30%(!). And the WaPo count of people killed by cops? Up 9% from a low in 2015 and 2019. Up is worse than down, I guess. But it kind of goes against the whole “Police Violence Higher Than Ever!” manufactured outrage.
See if I said, “actually police shoot 5% fewer people now than before” and you said, “No, they shoot 10% more!” we could quibble about methods and sources and reasonable people could differ. But what if you said, “2022 was the deadliest year for police violence,” and I said, “Actually 65% fewer people are being killed by police than in the past” — and let’s also say I was right, because I am definitely more right than wrong — then how could you say “more than ever!”? Either the people who say this are unbelievably ignorant, and I don’t think they are, or they’re willfully telling miss-truths. In other words: lying.
Far be it from me to answer, “why?” I really don’t get it, because I think it’s bad strategy to say everything is getting worse if you want to improve policing and save lives. I think the issue is many people do not want better policing. They want “zero police violence.” They want to abolish police — believe them when they say so — don’t think “that’s so crazy they can’t possible mean it.” At least once you see the ideology, it clears the cognitive dissonance.
Anyway, they have these nicely funded non-partisan research organizations paid for by individuals or corporations who have people to give away money, people who don’t dig too deep into what the organization does but love the veneer of “equity” and “racial justice.” Some of the people working these organizations are hard workers and some are pure grifters. Most are somewhere in between. The thing about grifting is it ain’t easy, and the job is never done.And the donors these Philanthropic progressives also get the added benefit of having a few Black people (other than the caterers) show up at their parties.
Anyway, this is long way of saying “police violence” (a bad term that assumes “police violence” is bad; but we pay police to use “violence”, though I prefer the term force; use it judiciously, legally, and constitutionally; police use of force, call it what you will, is literally the function of police in society) is not at an all time high.
But here’s why this matters even more. If we ignore the progress made, progress will stop. Imagine if I could tell you we were going to reduce some form of dying by 70%? That’s what happened. Not by accident. Not by defunding. But by good leaders, pressured by the public, to care. And then academics who had free reign (and money through the Police Foundation) to research policing!
There’s a long and discombobulated thread of twitter for people who want to get into weeds on this.
Long story short: I knew OIC (officer-involved shootings) were down over decades. Because this is what I do. I talk to people. And there literally is no evidence anywhere that cops kill more people now than in the 1970s. We (anybody in the field) all know this. It’s both common sense (you think Tennessee v Garner had no impact?!) and backed by the very limited data we have. You get bits of data here and there. You talk to people who were there. One of the guys I worked with came on the job in 1968. He told about all the people he shot at. “I never hit anybody, but I shot at a lot of people. And there was no paperwork. You just had buy more ammo.”
But here was the problem: the national data (Vital Statistics and UCR) were wrong and horribly so. Anyway, the problem with looking back to the 1970s (or any times before 2015) is the data on police-involved shootings are scattered or really really bad. They _only_ city I knew that kept good numbers year after year was from 1970-on is NYC.
And so there are published reports from the 1970’s saying police killed 300 people a year. With more accurate data, I can show police just in cities with a total of 23.5 million people killed 228 people a year. And that is ~10% of the US population. So who knows how many people cops killed back then? But more than 300! Guessing (I hate to guess) I’d say near 2,000? There’s a greater story about the bad data, which matters if you care, but I won’t get into it here. But Professor David Klinger is the go-to for that kind of thing.
But this isn’t an “I told you so.” The point is if we don’t acknowledge policing has gotten better and much less lethal, we can’t continue to improve. Because policing has gotten better and less lethal. Not by chance but because people worked hard to make it so. And those who want to abolish policing are not helping the cause. But they do influence the public discussion. And many of the “reforms” they push for in response to cops killing people make the problem worse.
To deny the progress means to deny _decades_ of life saving research, policy, technology, education and training — even lawsuit –that drastically change police culture and practice. It worked. It made policing safer , too. Why pretend it didn’t happen?
(Thanks to David Klinger, Justine Nix, Rajiv Sethi, John Shjarbackand, David Thacher, and Robert VerBruggen who helped move the methods and data and discussion along, mostly on twittter!)
-
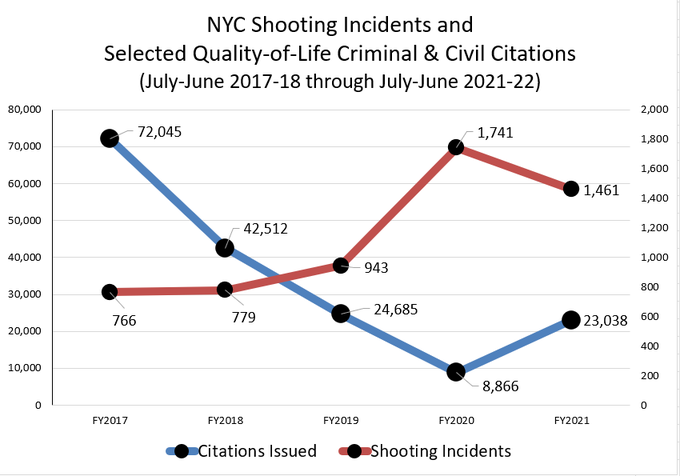
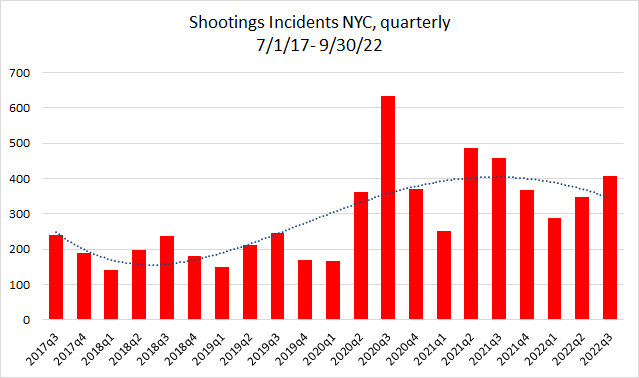
The correlation between more police enforcement and fewer shooting incidents in NYC
In early 2021 I pointed out, which was a considered a radial concept by many at the time, that violence had indeed gone way up since the unrest following the murder of George Floyd.
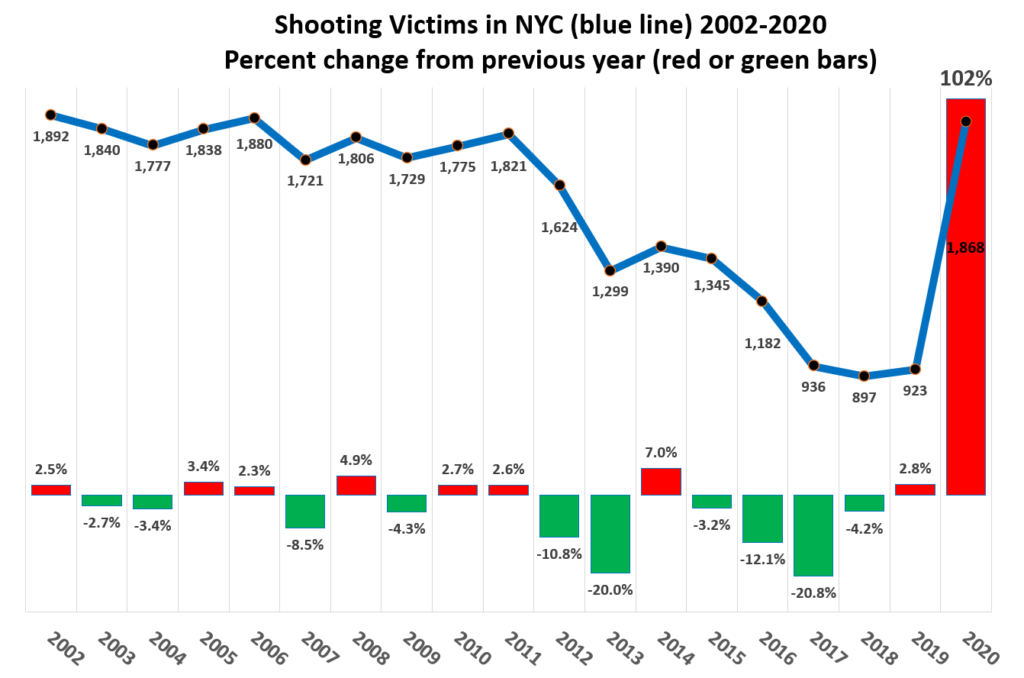
I wanted to update the data in that post about the relationship between enforcement (or lack thereof) and violence. So I did.
Breaking it down by quarter shows heavy seasonal effects. So it’s more useful to compare every 4th bar (same quarter, different year) than every adjacent bar. 3Q 2019 vs 3Q 2020 is the most dramatic.
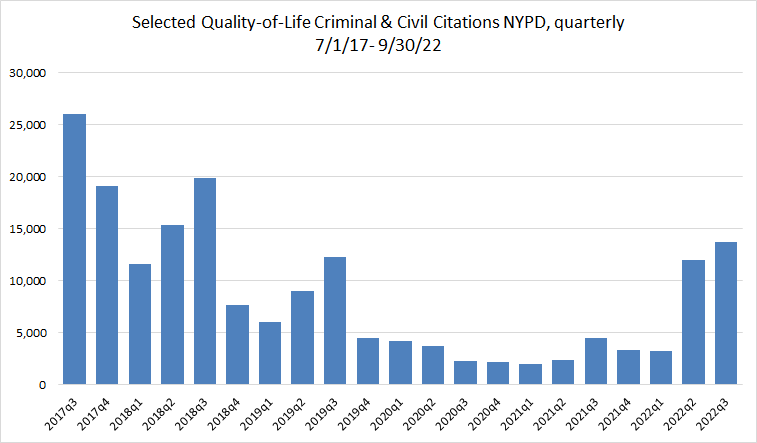
Here are the categories and numbers.
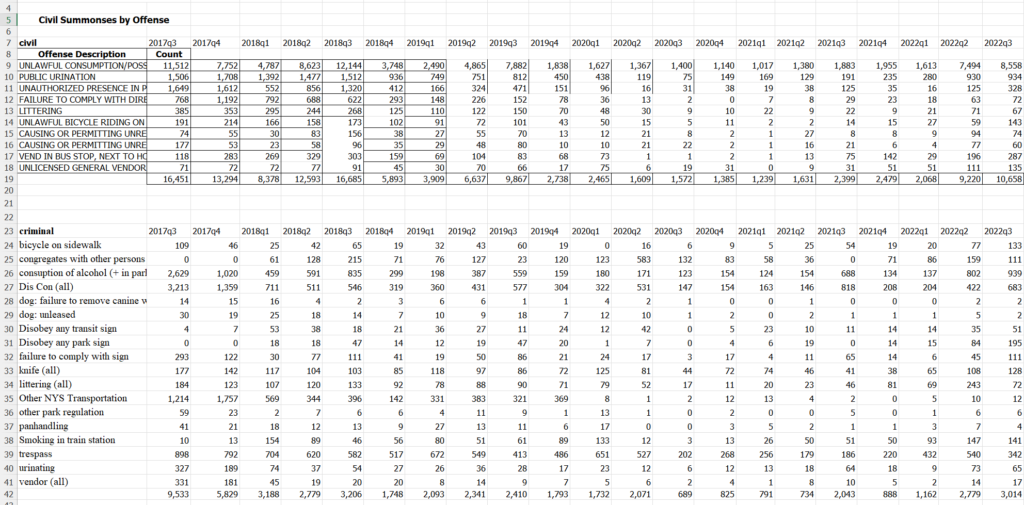
I picked the categories to ones that mattered and to try and limit enforcement to NYPD enforcement and not the enforcement of other agencies (like building and fire and health inspectors). Some of terms have shifted over time. Like “failure to comply with sign” has kind of morphed into “disobey any park sign.” Discon has all but disappeared but “congregates with other persons” has taken up some of the slack, going from zero to 111. The only low-level categories that have increased since 2017 are smoking in train station and bicycle on sidewalk. The basic end of policing in the 3rd quarter of 2020 is pretty striking. It’s also when shootings reached their many-year high.
Sources: https://www.nyc.gov/site/nypd/stats/reports-analysis/c-summons.page and NYPD
-
NY arrests, pre-trial release, and rearrests
Far be it for me to say if these changes are because of changes in law, police, bail reform, or prosecution,but things have changed in NY. And blaming “bail reform” may be simplistic. But crime AND recidivism have gotten worse, and “changes in law, policing, bail reform, discovery reform, the diaphragm law, raise the age, Less is More Act, and prosecution” doesn’t quite roll off the tongue nicely. And of course it’s nearly impossible in the real world to separate variables that change at the same time. But things have changed.
There’s something very disingenuous when advocates say, “it’s not bail reform,” as if the common person is supposed to know the name of every bit of reform that has happened in the past few years. The onus should be on reform advocates to ensure public safety, not the public to know which part of the reform movement screwed things up. Of course other double down and say the the entire “crime” rise is, and I quote more than one person, “a hoax.”
Now back to a recidivism figure — and it’s hard to figure out the best one to use — usually recidivism is defined as 3 or 5 years after release from incarceration. but here we’re talking about similar but different: the odds of reoffending in 180 days is a low threshold. And the data is even more limited because many cases don’t last that long. I think having an open pending case when arrested again is one fair measure of recidivism. In 2021 it was 36% in New York State (34% in NYC and 41% upstate) and was just 29%(?) in 2019. The increase was greatest upstate, from 31% to 41%. Just to be clear. This means that in Upstate New York (Upstate is defined in a very NYC way as everything but NYC and surrounding counties) 31% of those arrested in 2019 had an open pending criminal case. In 2021 the figure jumped to 41%. People notice. People vote. And as some point you can’t fool all of the people all of the time.
For instance, it’s been reported, and more than once, that “less than 2% re-offend!” If comes from this, which if nothing else, really pushes the limits of acceptable truth telling. https://www.nycja.org/pretrial-release-dashboard.
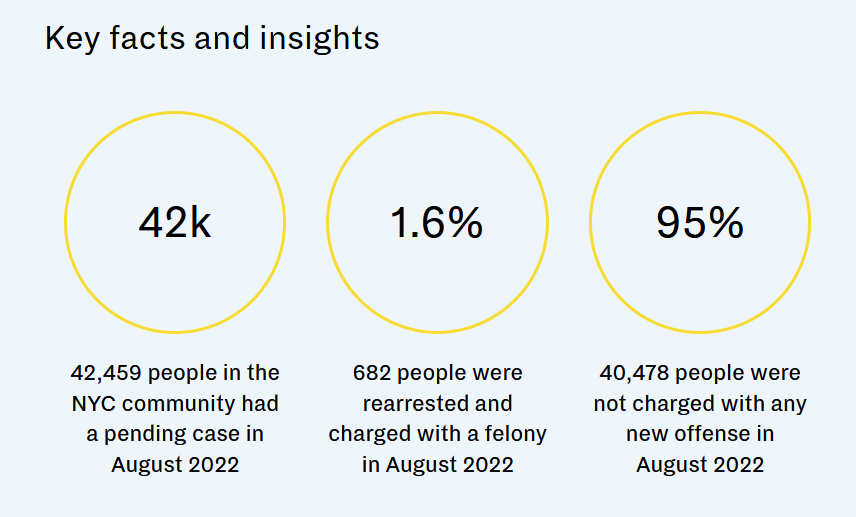
To put it gently, never is the history of criminal justice data presentation has “felony rearrests in August 2022” been presented as a “key fact and insight.” (Nor have I ever heard of the “NYC community,” but I’ll pick my battles.) I’m not saying monthly re-arrest is not a useful figure in terms of comparing trends in felony pre-trial recidivism over time. That’s a novel concept. Kudos. But to highlight 1.6% as a “key” fact? Doesn’t rub me right in the ol’ data-presentation integrity department. But at least it is clearly stating what it means. What really bothers me are those who know better and still take anything on a screen and then say “less than 2% re-offend!” Professors and institute people and even journalists who know the data isn’t reflecting the truth, but are happy to use it because they can cite it to something. Yet they know it’s not true and do so anyway. Yes, I’m talking to you. (I hope that causes a lot of people to react.)
What matters, as most people understand it, is how many people under criminal justice control hurt somebody else while “in the system,” pending trial or post conviction and released. Not how many do so in August! 95% charged with a new offense in August 2022? Honestly, I’d say that 1 in 20 being charged with a new offense in one month(!) is pretty significant.
The percentage of people rearrested in NY State while there case was still pending and within 180 days of arraignment in 2021 was 21%. This is up from 18% in 2019. 10% were arrested for a felony in 2021, up from 7.3% 2019. For all these figure 2020 is even higher, but I’m leaving it out because Covid really did affect everything, including the number of cases that were not finishing within 180 days. I have a lot of issues with “180 days” because people will mistake it for a true measure of recidivism, which it is, sort of, but only in a comparative sense. And even then one must assume (incorrectly) that courts have moved at constant speed, and we know that haven’t. Since fewer cases are adjudicated within 180 days in 2020, more people will be counted as rearrested. The true re-arrest number is higher, as cases linger, but “180 days” is good because we can use 2021 data and compare it to 2020 and 2019. (Since we have the first 180 days for 2022 data.) Another (perhaps better) measure of pre-trial recidivism is the percent of people arrested who have another open case still pending. (I’ll get to that later.)
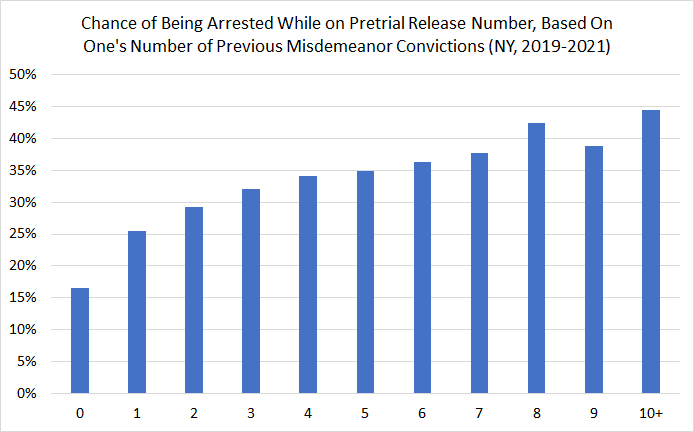
FWIW, 1,251 people were arrested in NYC in 2021 and then, and within 180 days, were rearrested for both a violent felony AND again for a non-violent felony. 20% of this group had a previous firearm arrest. 9% were re-arrested for a firearm. Now in a city of 8,500,000 with 76,534 people in this sample of arrests in 2021, 1,251 is pretty small, 1.6% to be precise. But that’s the thing. Of this small group 18% (n=221) also have 10 or more misdemeanor convictions. These people ARE recidivism. Who do you think is pulling the trigger? Really. Guns don’t shoot themselves. People pull the trigger. And a full people pull the trigger a lot.
Data Prep, feel free to skip this part, but it’s here both for transparency, replication, and fact checking. The raw data can (should) be downloaded here: https://ww2.nycourts.gov/pretrial-release-data-33136 It’s a CVS data file. It is not novice friendly. I used SPSS for analysis. The actual file you’re looking for is Supplemental_Pretrial_Release_Data.csv. “This file contains arraignments resulting from arrests requiring fingerprints from Jan. 1, 2019, through Dec. 31, 2021.” And do not forget the data dictionary, as you’ll need it.
File contains 562,646 cases. Here are some very basic numbers and demographics:
Roughly just under half the people arrested in New York State are convicted (2019-2021). 0.1 are acquitted (423 in three years, to be precise). Most of the rest of the cases are dismissed. Of those convicted, 18% percent are sentenced to jail or prison.
Of those arrested: 79.6% Male. 49.6% Black, 43.4% White, 4.1% Asian. 26.3% Hispanic. For non-Hispanics: 60% Black, 33% White, 5.6% Asian, <1% some other categories.
Total arrests arraigned in NY State 2019: 229,090; 2020: 156,610; 2021: 166,012.
After all the cutting that follows below (25% of the sample) none of the percentages above changed to any degree (which is generally a good sign).
I selected for arrests between 2019 and 2021, which leaves 551,712 cases. (many arrests go back a bit from DATs and a few go back decades, as I guess a warrant was issued.) Then I excluded 68,392 cases which were bumped up to arraignment in Upper Courts, because these cases no longer appear in lower court data (best I understand). That leaves 483,320. I dropped 47 non-NY-State arrests just because they were in my way. n= 482,273.
I cut cases (61,204) in which Lower Court-First Pretrial Release Decision at Arraignment was “Disposed at arraign,” because these cases are not followed. Same for 6,035 “unknown” in that category. Not followed. n = 422,069
So this is the sample I’m going to use. 172,526 arrests from 2019. 121,212 arrests from 2020. 128,331 arrests from 2021. Now 2020 is kind of an outlier because of Covid plus protests and riots. Things shut down. Generally everything spiked in 2020 and then came down a bit in 2021. 2019 and 2021 are good years to compare pre- and post- everything that changed (and not just bail reform).
Of those cases: 245,756 are in New York City. 72,470 are “Suburban NYC” (Nassau, Suffolk, and Westchester Counties). 109,843 are the rest of NY State.
I created a few new variables. I combined violent felony (VFO), felony, OR misdemeanors into one category for pending charge and for re-arrests. Seems important.
So that was fun, but now what? What can we learn? Well given the data we have.
Other tidbids This is for un-trimmed state data (I didn’t want to exclude cases kicked up to upper court for this). Chances of conviction and dismissal are roughly equal. There are (almost) no acquittals. Most of the “pending” will end up as convictions.
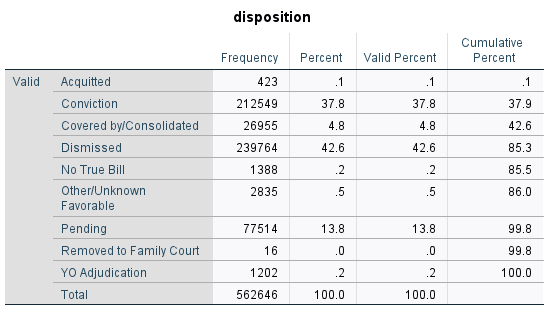
Most of those pending cases will end up as convictions. For instance in 2019 the number still pending is just(?) 5.5%. And conviction in 2019 was nearly 50%. 42% of cases in 2019 were dismissed.
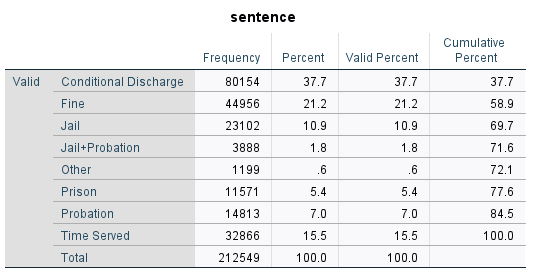
What else, for those convicted, 27,000 get jail (less than a year) or jail and probation. Another 11,600 prison. So fewer than 40,000 get some form of incarceration as punishment Given the total of over 500,000 arrests in three years, it’s not that many people sentenced to incarceration. I mention this, in part, because any reform house of cards movement built on the idea that we’re locking everybody up and for nothing is going to fall. Because it’s not true.
(Now I’m back to the data set I was using where n = 422,069) Citywide 9.6% of arrests in 2021 had a pending open violent felony case. This is up from 5.3% in 2019. In numbers we’re talking 7,322 people arrested in 2021 with open violent felony cases. There’s possibly some low-hanging crime prevention possibilities here, were we willing to detain people arrested for violent felonies.
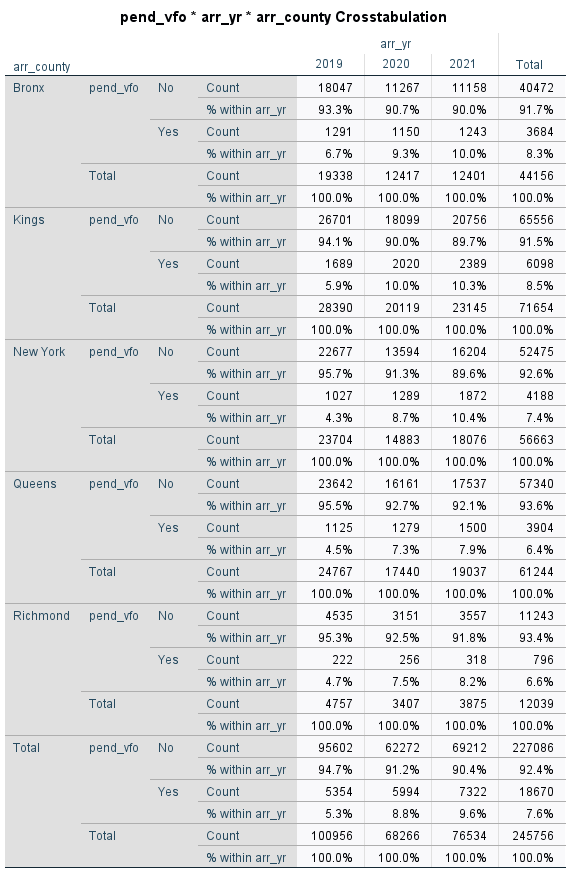
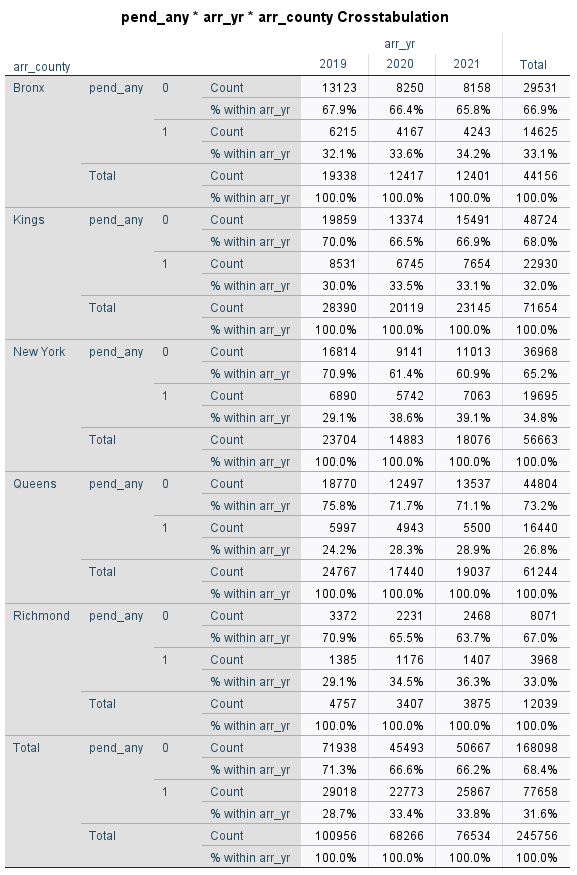
In 2021: 33.8% in NYC arrests had an open case (29% in Queens and 39% in Manhattan). In 2019 28.7% (24% in Queens and 29% in Manhattan).
In 2021 New York City, 20.8% of people arrested and arraigned and were released and arrested again (n=15,893) in 180 days. Compared to 19.9% in 2019. 14% rearrested for a felony in 180 days (up from 10.8%). 4.5% (n=3,436) for violent felony in 180 days (up from 3% in 2019).
Here’s a chart title you’ve never seen before, and perhaps for good reason. But I’m trying to show that there are a few people who keep committing crime over and over again. And we can identify them… because they keep getting arrested over and over again.
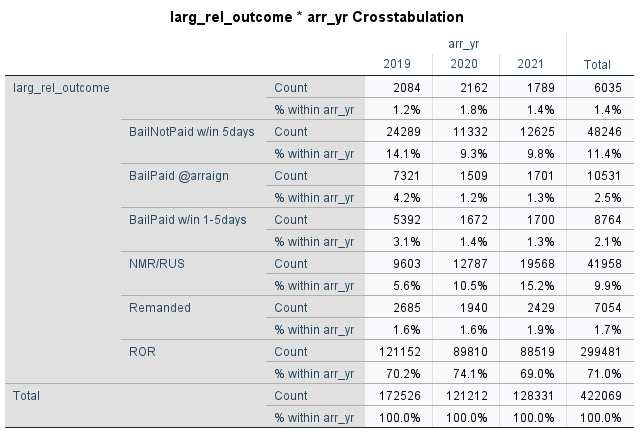
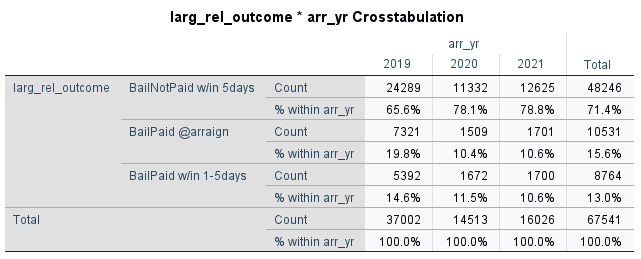
Some more data. NY State, 2019-2021. Release decision at arraignment (lower court arraignment = “larg”). ~12% are detained. And then the release outcomes. And then for the 12.5% for whom bail is set, what happens. In 2021 79% didn’t post bail (were still jailed) within 5 days, up from 66% in 2019.

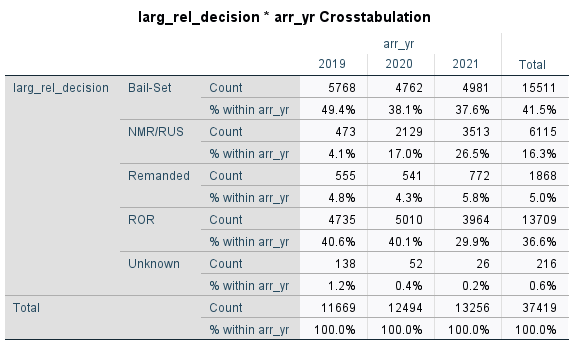
Now just selected for Violent Felony charges (VFO): 6% remanded in 2021. 38% bail set (of those 2/3rd remained jailed after 5 days). 30% RORd (released). 27% released with “supervision,” which has been the big push. (I’d love to see more data and outcomes in this category.)
(All data unchecked. Corrections welcome. Sorry for the typos.)
-
The Rebirth of 42nd Street
The first excerpt from my book has been published by the (very) good people at Vital City.
Check it out: https://www.vitalcitynyc.org/articles/peter-moskos-oral-history-times-square
-
Arrests down 25% in 2020?
I’m going to start with a bunch of caveats. A) This is crude data analysis. B) It it based on incomplete Uniform Crime Report data dependent on reliable data reported (not a given). C) I may have simply done this wrong. It’s 2AM. D) This is important: arrests are NOT good for their own sake, but most policing is discretionary. And arrests can be a decent proxy for proactive policing. All that said, there’s something important going on here, based on last year’s UCR Arrest data, limitations and all.
Arrests in the US (again with the very important caveats, above) dropped 1% in 2018, 10% in 2019, and then 25%(!) in 2020. That’s shocking. As much as 29% increase in murder. If this is good data, this is very consistent with a “Ferguson” like “George Floyd protest” effect.
For whatever reason (I have my theories), police policed less in 2020. At least when they had a choice not to engage. That’s not good, despite what less policing advocates say.
The kind of arrests down most are _exactly_ the crimes police can simply choose to ignore. “Suspicion” (though it’s a super small category of <1K. I’d ignore this were the name not so perfect) down 65%. Prostitution down 43%. Vagrancy (also small and not arrestable in some places) down 36%. Liquor arrests down 37%.
Maybe police were busy with other things, maybe they didn’t want to—for Covid or fear of viral video or bad morale reasons)—but for whatever reason, they didn’t. Arrests were down 25% as violence was up a similar and record level. This is kind of unheard of.
Curfew/loiter arrests were down 41%. Disorderly down 29%. Drunkenness arrests down 39%. Runaways down 58%. None of these are huge categories, by they way, but they are all indicative of cops not engaging when they could have, and did more in 2019.
Big categories? DUI is a great example of proactive policing. Cops don’t _have_ to stop a swerving motorist. Might lead to force. For better or for worse, police arrested 22% fewer DUIs in 2020 (590K). Drug arrests down 27% (895K). “Other assaults” down 14% (700K).
Arrests up? Weapons, up 3%. I’d guess cause more people had weapons and knew how to use them. Murder arrests were up 2% (and also negligent manslaughter). Since murder was up 29% arrests should have been up more. Arson (not many) up 8%, presumably related to riots.
What’s this mean? That’s the quiz. But if these data are correct (again, no guarantees) there was a huge demonstrable decrease in police enforcement in 2020. A perfect example of what reformers want: less policing. Was that the cause of violence, I don’t know. but it matters.
Pls don’t overthink this. Shootings/murders up a record level in 2020. Covid was a global pandemic. The rise in violence was uniquely America. And so was de-policing. No, such a correlation doesn’t automatically equal causation, but it might. I’ve heard of no better theory.
Arrests, while technically the front end of incarceration, are basically unrelated to mass incarceration. Violent crime and long sentences are the driver of prison. I guarantee that even a massive 1/4 decline in arrests will have an approx 0% impact on prison population.
People are not going to prison for sentences related to the category of “all other arrests.” The point is that policing that _might_ lead to such an arrest matters, and is not being done. (Again, arrests are not “good,” they can be a proxy for policing being proactive.)
I looked at the largest UCR categories of arrest by race. Everything declined substantially. For each of these categories (*except DUI) Black arrests declined a greater % than white arrests. Good or bad? Not my point. But these are noteworthy indicators of unequal depolicing.
-
The beginning of Compstat
A new podcast episode talks about the origin stories of NYPD’s compstat with, William Gorta, one of the “founding fathers.”
-
A list of police-centered and police-related crime reduction studies
My blog has moved, for a current list of academic research and studies that focus on police-centered and police-related crime reductions, please go: https://qualitypolicing.com/a-list-of-police-centered-and-police-related-crime-reduction-studies/
For more ways to reduce violence, see the collection of essays at my Violence Reduction Project.
-
Baltimore Stops Policing
I thought not clearing drug corners after the 2015 riots was a big deal. It was. Murders nearly doubled. But “little” things like this are big deals.
And very few will notice the cause and effect after the fact. That’s the shame. There’s no accountability for what are purely political decision. “Cops are pulling back!” they’ll say. And it’s true. But people need to get at the way.
Baltimore cops are being told (the “after consulting with a lieutenant or above” is the hammer) to not arrest for drugs, attempted distribution of drugs, prostitution, trespassing, “minor” traffic offenses (minor without-quotes traffic offenses are already not arrestable) public drinking, and pissing or shitting in public.
This is a big deal. Who wants this? It’s a political choice, and a bad one.
“Rogues and vagabonds” can finally rogue and vagabond in peace.
-
FOP Baltimore Blueprint
This was released 9 years ago. It was ignored. It wasn’t a bad plan. Had it been adopted, a lot might have been better.
It’s interesting to me because I’m not a big fan of police unions. But I am fan of unions. And here’s a union not fear mongering or being racist but trying to do good. And the report was ignored.
Since then there was a riot, murders has nearly doubled and the DOJ came out with a much worse report. Such is progress.
Here is what I wrote about the report when it came out:
Here is what I wrote about it after the 2015 riots:
